Process Post 2
This week, our learning pod focused on research about social media use in teenagers. We also tracked our own screen time to compare personal habits with the data.
What the Data Showed
Recent data shows a clear rise in social media use among teens. According to Pew Research Center (2024), almost half of teens say they are online almost constantly. This is twice the rate from ten years ago. YouTube is the most used platform at 90%. TikTok and Instagram follow at about 60%, and Snapchat at 55%.
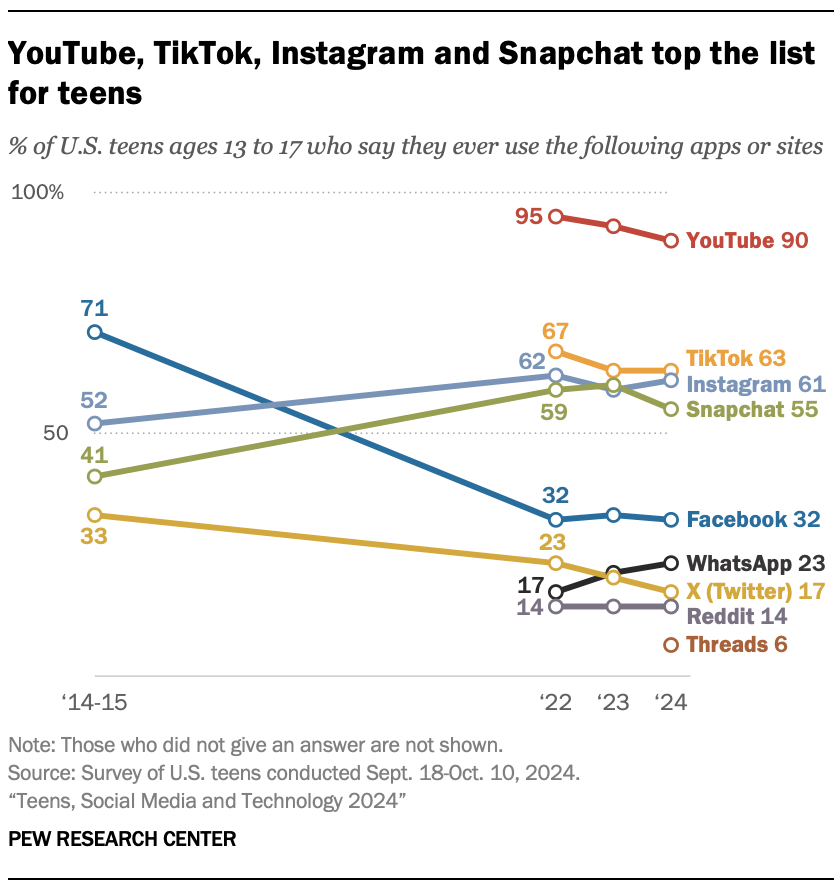
Figure 1: Percentage of US Teenagers most used Social Media apps (Source: Pew Research Centre)
There are concerns about how this level of use affects wellbeing. Statistics Canada (2026) found that only 14% of youth stayed within the recommended 2 to 3 hours of daily screen time. At the same time, 37% exceeded this limit in both 2019 and 2023. Youth who stayed within the limit reported better outcomes. About 58% reported very good mental health, compared to 38% of those who exceeded the limit. Academic performance also differed. 94% of lower-use students had grades above 70%, compared to 88% of higher-use students.
Higher levels of screen time show more serious risks. Youth who spend 7 or more hours per day on screens are more likely to experience anxiety, depression, and suicidal thoughts (MHRC, 2024).
Figure 2: Anxiety Symptoms and Daily Personal Screentime (Source: MHRC, 2024)
However, not all screen time is the same. Santos et al. (2023) explain that the term “screen time” is too broad. Passive scrolling and active learning are counted the same, but they are very different activities. This idea is important for our inquiry.
My Own Social Media Use
My weekly average screen time is one hour and thirty minutes. My most-used apps were Instagram, TikTok, and WhatsApp. Almost every time I picked up my phone, it was out of boredom. This happened most when I was switching between tasks or when something felt hard to start. Most of the time I was already scrolling before I had made a conscious decision to open my phone.
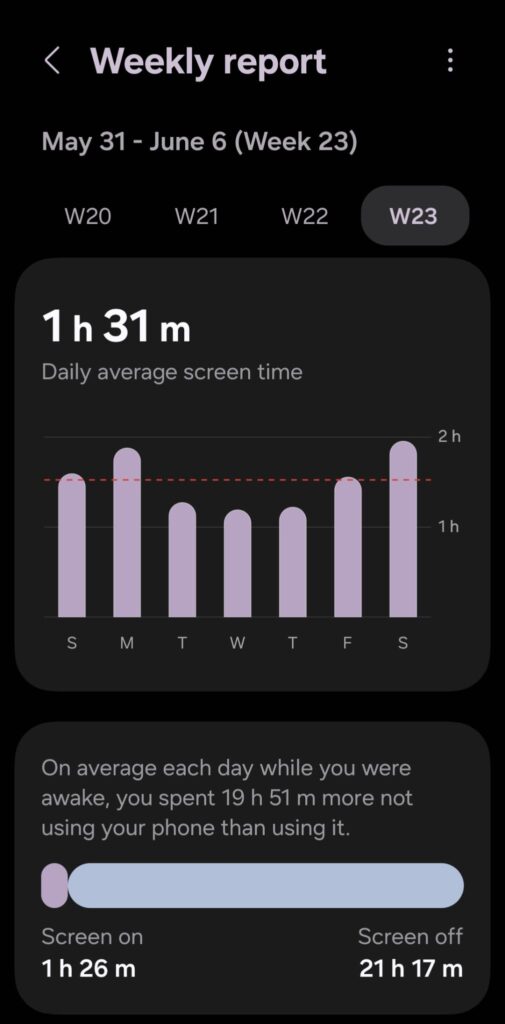
Figure 3: Weekly Average Screentime
Not all of my screen time was the same. WhatsApp is how I stay in touch with family and friends, often across different time zones. That is different from opening TikTok to put off starting an assignment. Both show up in the same daily total, but they are not the same behaviour. This connects back to the point Santos et al. (2023) made about screen time being too broad a term.
Looking Ahead
In the next few weeks, I will track why I reach for my phone rather than just how often. I want to identify patterns and triggers. If boredom is the main reason, I want to understand what I am avoiding and how I can stay more engaged in my learning.
I also plan to explore how social media is used in digital learning environments. I want to understand its impact on student engagement and outcomes.
References
Mental Health Research Canada. (2024). Screen time and youth mental health. https://www.mhrc.ca/screen-time-youth-mh
Pew Research Center. (2024, December 12). Teens, social media and technology 2024. https://www.pewresearch.org/internet/2024/12/12/teens-social-media-and-technology-2024/
Santos, R. M. S., Mendes, C. G., Sen Bressani, G. Y., de Alcantara Ventura, S., de Almeida Nogueira, Y. J., de Miranda, D. M., & Romano-Silva, M. A. (2023). The associations between screen time and mental health in adolescents: A systematic review. BMC Psychology, 11(1), Article 127. https://doi.org/10.1186/s40359-023-01166-7
Statistics Canada. (2026, March 19). Screen time and well-being among Canadian youth. https://www150.statcan.gc.ca/n1/daily-quotidien/260319/dq260319b-eng.htm